
Last modified July 9, 2026
Creating a Grafana organization
This guide walks you through creating and configuring Grafana organizations to implement multi-tenancy in your observability platform.
Prerequisites
Before creating your organization, make sure you have:
- Access to the management cluster, where you can create custom resources
- Identified the tenant names you want to use
- Configured groups for RBAC in your identity provider
Understanding default organizations
Before creating your own organizations, it’s helpful to know about the two that already exist:
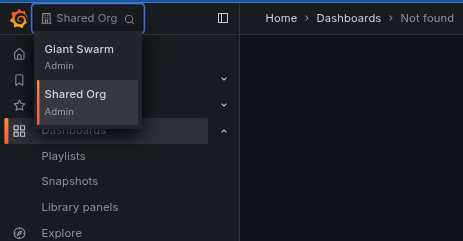
- Shared Org: Your starting point with system dashboards and platform metrics (uses
giantswarmtenant) - Giant Swarm: Internal organization for platform operations (Giant Swarm staff only)
Your organizations will appear alongside the Shared Org in the organization dropdown. Learn more about these in our multi-tenancy overview.
Creating a GrafanaOrganization resource
Create a GrafanaOrganization custom resource in the management cluster:
Basic example
This example shows a simple organization for a single application with role-based access for different teams:
apiVersion: observability.giantswarm.io/v1alpha2
kind: GrafanaOrganization
metadata:
  name: myonlineshop
spec:
  displayName: MyOnlineShop
  rbac:
    admins:
    - customer:platform-admin
    - customer:ops-team
    editors:
    - customer:development-team
    - customer:devops-team
    viewers:
    - customer:marketing-team
    - customer:business-analysts
  tenants:
  - name: myonlineshop
    types:
    - data
    - alerting
Deprecated: v1alpha1 is deprecated. Please use v1alpha2 for new resources.
apiVersion: observability.giantswarm.io/v1alpha1
kind: GrafanaOrganization
metadata:
  name: myonlineshop
spec:
  displayName: MyOnlineShop
  rbac:
    admins:
    - customer:platform-admin
    - customer:ops-team
    editors:
    - customer:development-team
    - customer:devops-team
    viewers:
    - customer:marketing-team
    - customer:business-analysts
  tenants:
  - myonlineshop
Configuration options
| Field | Description | Required |
|---|---|---|
metadata.name | Kubernetes resource name (follows DNS naming rules) | Yes |
spec.displayName | Human-readable name shown in Grafana UI | Yes |
spec.rbac.admins | Groups with full organization access | Yes |
spec.rbac.editors | Groups that can create/edit dashboards and alerts | No |
spec.rbac.viewers | Groups with read-only access | No |
spec.tenants | List of tenant configurations this organization can access | Yes |
Advanced examples
Multi-environment organization:
This example demonstrates an organization that manages multiple environments with hierarchical access control:
apiVersion: observability.giantswarm.io/v1alpha2
kind: GrafanaOrganization
metadata:
  name: engineering-team
spec:
  displayName: Engineering Team
  rbac:
    admins:
    - customer:engineering-leads
    editors:
    - customer:senior-engineers
    - customer:devops-team
    viewers:
    - customer:junior-engineers
    - customer:qa-team
  tenants:
  - name: prod-frontend
    types:
    - data
    - alerting
  - name: prod-backend
    types:
    - data
    - alerting
  - name: staging-frontend
    types:
    - data
  - name: staging-backend
    types:
    - data
Deprecated: v1alpha1 is deprecated. Please use v1alpha2 for new resources.
apiVersion: observability.giantswarm.io/v1alpha1
kind: GrafanaOrganization
metadata:
  name: engineering-team
spec:
  displayName: Engineering Team
  rbac:
    admins:
    - customer:engineering-leads
    editors:
    - customer:senior-engineers
    - customer:devops-team
    viewers:
    - customer:junior-engineers
    - customer:qa-team
  tenants:
  - prod-frontend
  - prod-backend
  - staging-frontend
  - staging-backend
Production-only organization:
This example shows a restricted organization with access only to production data:
apiVersion: observability.giantswarm.io/v1alpha2
kind: GrafanaOrganization
metadata:
  name: production-monitoring
spec:
  displayName: Production Monitoring
  rbac:
    admins:
    - customer:sre-team
    - customer:platform-admin
    viewers:
    - customer:engineering-team
    - customer:support-team
  tenants:
  - name: production
    types:
    - data
    - alerting
Deprecated: v1alpha1 is deprecated. Please use v1alpha2 for new resources.
apiVersion: observability.giantswarm.io/v1alpha1
kind: GrafanaOrganization
metadata:
  name: production-monitoring
spec:
  displayName: Production Monitoring
  rbac:
    admins:
    - customer:sre-team
    - customer:platform-admin
    viewers:
    - customer:engineering-team
    - customer:support-team
  tenants:
  - production
Granular access control (v1alpha2 only):
With v1alpha2, you can specify different access types for fine-grained control:
apiVersion: observability.giantswarm.io/v1alpha2
kind: GrafanaOrganization
metadata:
  name: mixed-access-org
spec:
  displayName: Mixed Access Organization
  rbac:
    admins:
    - customer:platform-admin
    editors:
    - customer:ops-team
    viewers:
    - customer:read-only-team
  tenants:
  # Full access (data and alerting)
  - name: critical-services
    types:
    - data
    - alerting
  # Data access only (no alerting)
  - name: development-metrics
    types:
    - data
  # Alerting access only
  - name: alerting-management
    types:
    - alerting
RBAC configuration
The RBAC section maps identity provider groups to Grafana organization roles:
| Role | Permissions |
|---|---|
| Admin | Full organization access: manage users, datasources, dashboards, and settings |
| Editor | Create and edit dashboards, alerts, and folders (can’t manage users) |
| Viewer | Read-only access to dashboards and data |
Group format
Most Giant Swarm installations use Dex as the identity provider. Specify groups using the format {dex-connector-id}:{group-name}:
rbac:
  admins:
  - customer:platform-admin        # Maps 'platform-admin' group from 'customer' connector
  - customer:ops-team
  editors:
  - customer:development-team
  viewers:
  - customer:support-team
Finding your connector ID: Check your cluster’s Dex configuration for the connector ID (usually customer).
Required fields: admins is mandatory. editors and viewers are optional.
Migrating from v1alpha1 to v1alpha2
If you have existing v1alpha1 organizations, see migrate Grafana organizations to v1alpha2 for the differences between the versions, conversion examples, and migration best practices. New resources should use v1alpha2 directly.
What happens when you create an organization
Creating a GrafanaOrganization resource automatically provisions:
- New Grafana organization with your specified display name
- Tenant-scoped datasources for Loki, Mimir, and Alertmanager
- User role assignments based on your RBAC configuration
- Data collection of alerts, logs, metrics, and traces
Verification steps
After creating your organization:
Check organization status:
kubectl get grafanaorganization myonlineshop -o yamlLog in to Grafana and verify:
- The organization dropdown menu on the top-left corner shows all expected organizations
- You can explore and query data for each of your tenants
- Logged-in users have appropriate role assignments under the
Administration / Users and access / Userssection
Need help, got feedback?
We listen to your Slack support channel. You can also reach us at support@giantswarm.io. And of course, we welcome your pull requests!